
Canvas & Charts
Canvas has no DOM inside it, so locators stop at its edge. Click by coordinates, draw with the mouse, and read chart values from tooltips. Each task ticks itself when its result box turns green.
1.Moving Target
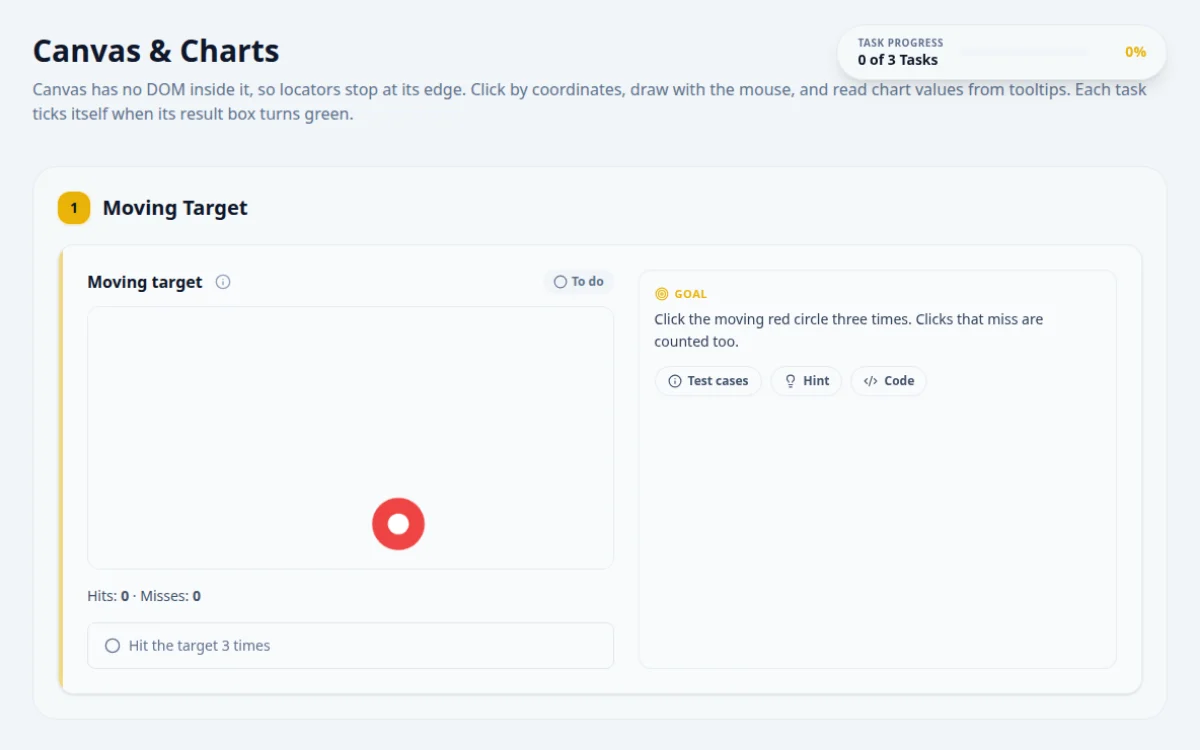
Hits: 0 · Misses: 0
Click the moving red circle three times. Clicks that miss are counted too.
- Three hits turn the result green.
- Clicking where the target used to be is a miss.
Call window.qaCanvas.target() right before each click and click at the canvas's left + x, top + y.
// The page exposes the target's position: window.qaCanvas.target() returns {x, y}
const canvas = page.locator('#target-canvas');
await canvas.evaluate((el) => el.scrollIntoView({ block: 'center' }));
for (let i = 0; i < 3; i++) {
  const box = (await canvas.boundingBox())!;
  const t = await page.evaluate(() => (window as any).qaCanvas.target());
  await page.mouse.click(box.x + t.x, box.y + t.y);
}
await expect(page.locator('#canvas-hits')).toHaveText('3');2.Draw a Line
Press inside Start, drag to End in one continuous stroke and release inside End.
- A continuous stroke from Start to End turns the result green.
- Jumping straight to End without the moves in between fails.
- Starting or ending outside the boxes fails.
Press inside Start, move to End in ten or more small steps, then release. One big jump is ignored.
const canvas = page.locator('#draw-canvas');
await canvas.evaluate((el) => el.scrollIntoView({ block: 'center' }));
const b = (await canvas.boundingBox())!;
await page.mouse.move(b.x + b.width * 0.1, b.y + b.height / 2);
await page.mouse.down();
await page.mouse.move(b.x + b.width * 0.9, b.y + b.height / 2, { steps: 20 }); // a stroke needs steps
await page.mouse.up();3.Chart Tooltip
Hover the bars to read each month's sales, then enter the month with the highest sales.
- Hovering a bar shows a tooltip such as 'Mar: 4,210'.
- Entering the peak month turns the result green.
- The values are not in the page until you hover.
Hover each bar, wait for the tooltip to name that month, and keep the largest number.
const bars = page.locator('#sales-chart [data-month]');
let best = { month: '', value: -1 };
for (let i = 0; i < (await bars.count()); i++) {
  const month = (await bars.nth(i).getAttribute('data-month'))!;
  await bars.nth(i).hover();
  await expect(page.locator('#chart-tooltip')).toContainText(month);
  const value = Number((await page.locator('#chart-tooltip').innerText()).replace(/\D/g, ''));
  if (value > best.value) best = { month, value };
}
await page.locator('#peak-month').fill(best.month);
await page.locator('#check-peak').click();
4. Solutions
Try the challenges yourself first. Reference solutions are hidden until you ask for them.
About this Canvas & Charts page
Canvas testing is automating a drawing surface where shapes are pixels, not DOM elements, so locators cannot find them. You work with coordinates instead: click at an offset, press and drag the mouse to draw, and read results from the page state or a screenshot. This page gives you a moving target, a stroke task and chart tooltips to practice.
Frequently asked questions
How do you click a specific point on a canvas in Playwright?
Use locator.click({ position: { x: 120, y: 80 } }), where the position is relative to the canvas top-left corner. For a moving target, read its coordinates from the page via evaluate, or expose them in app state, then click at that position.
How do you click a canvas by offset in Selenium 4?
Use new Actions(driver).moveToElement(canvas, x, y).click().perform(). In Selenium 4 the offset is measured from the element's center, not its top-left, so subtract half the width and height from your coordinates.
How do you draw on a canvas in an automated test?
Move the mouse to the start point, press the button, move through several points, and release. In Playwright: mouse.move, mouse.down, mouse.move with steps, mouse.up. In Selenium: clickAndHold, moveByOffset calls, release. Then verify via app state or a screenshot.
How do you verify a chart tooltip drawn on a canvas?
Hover the data point coordinates, then read the tooltip. If the tooltip is DOM-based, assert its text normally. If it is drawn on the canvas, compare a screenshot with toHaveScreenshot, or read the chart library's data through page.evaluate.
Why can't I find elements inside a canvas with locators?
A canvas is a single bitmap element. Shapes drawn into it are not in the DOM, so CSS and XPath cannot target them. Use coordinate input, JavaScript access to the app's model, or visual comparison instead.
Free developer tools on Randomly.online
QA Playground is part of Randomly.online. These tools help while you write and debug tests: